
Chris Cannam has developed Sonic Visualiser, an application for viewing and analysing the contents of music audio files.
As well as a number of features designed to make exploring audio data as revealing and fun as possible, Sonic Visualiser also has powerful annotation capabilities to help you to describe what you find, and the ability to run automated annotation and analysis plugins in the Vamp analysis plugin format – as well as applying standard audio effects.
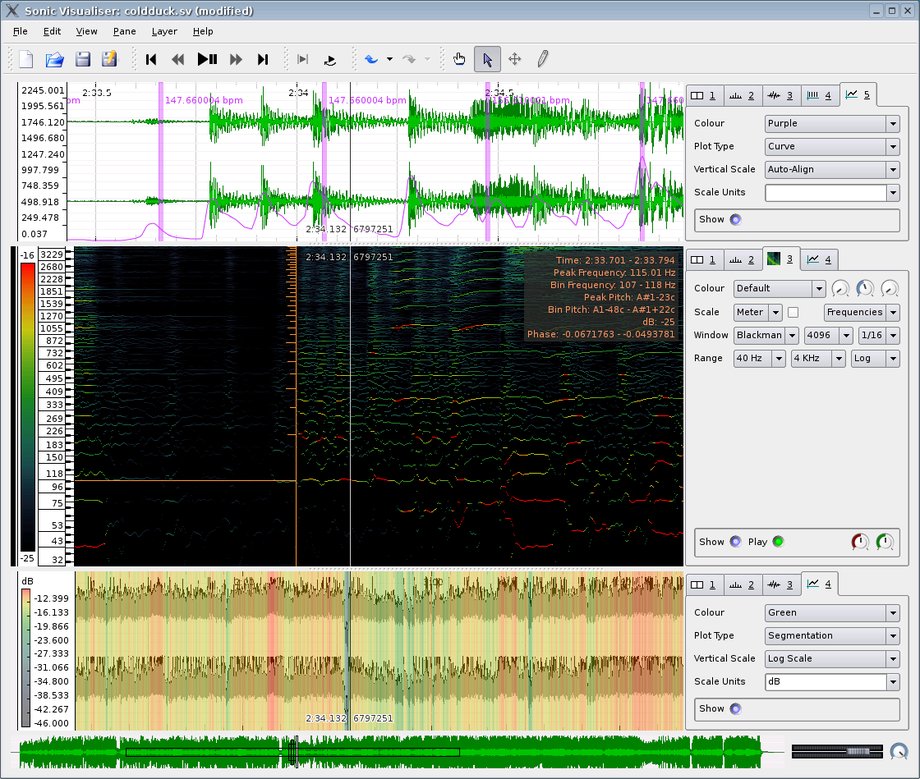
Sonic Visualiser 1.0 screenshot
Features
- Load audio files in WAV, Ogg and MP3 formats, and view their waveforms
- Look at audio visualisations such as spectrogram views, with interactive adjustment of display parameters
- Annotate audio data by adding labelled time points and defining segments, point values and curves
- Overlay annotations on top of one another with aligned scales, and overlay annotations on top of waveform or spectrogram views
- View the same data at multiple time resolutions simultaneously (for close-up and overview)
- Run feature-extraction plugins to calculate annotations automatically, using algorithms such as beat trackers, pitch detectors and so on
- Import annotation layers from various text file formats
- Import note data from MIDI files, view it alongside other frequency scales, and play it with the original audio
- Play back the audio plus synthesised annotations, taking care to synchronise playback with display
- Select areas of interest, optionally snapping to nearby feature locations, and audition individual and comparative selections in seamless loops
- Time-stretch playback, slowing right down or speeding up to a tiny fraction or huge multiple of the original speed while retaining a synchronised display
- Export audio regions and annotation layers to external files
Sonic Visualiser is released under the GNU General Public License. Source code and binaries for Linux, OS/X and Windows are available for download.
Visit the Sonic Visualiser website for more information.