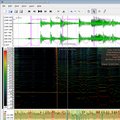
Chris Cannam of the Centre for Digital Music at Queen Mary, University of London, has released version 1.3 of Sonic Visualiser, an application for viewing and analysing the contents of music audio files.
As well as a number of features designed to make exploring audio data as revealing and fun as possible, Sonic Visualiser also has powerful annotation capabilities to help you to describe what you find, and the ability to run automated annotation and analysis plugins in the Vamp analysis plugin format – as well as applying standard audio effects.
Changes in Sonic Visualiser v1.3
- There is a new spreadsheet-style data viewer and editor for viewing and editing the data in some types of annotation layer.
- Alignments are now saved to the session file.
- The spectrogram layer is usually somewhat faster than it was.
- You can now hold Shift while dragging to move an item, in order to override the initial drag resistance introduced in 1.2.
- The gross mis-labelling of time lines in the ruler has been fixed.
- There is a new, somewhat provisional PulseAudio output driver.
- Several other bug fixes.
Sonic Visualiser is free software, distributed under the GNU General Public License and available for Linux, OS/X, and Windows.
More information: Sonic Visualiser


