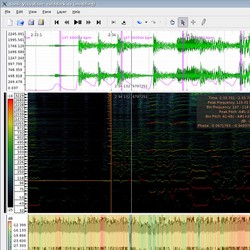
Chris Cannam has released version 1.6 of Sonic Visualiser, an application for inspecting and analysing the contents of music audio files, combining powerful waveform and spectral visualisation tools with automated feature extraction plugins and annotation capabilities.
The aim of Sonic Visualiser is to be the first program you reach for when want to study a musical recording rather than simply listen to it.
We hope Sonic Visualiser will be of particular interest to musicologists, archivists, signal-processing researchers and anyone else looking for a friendly way to take a look at what lies inside the audio file.
Changes in Sonic Visualiser v1.6
- The Colour 3D Plot layer now supports logarithmic vertical scale and linear interpolation options.
- A new colour scheme (High Gain) has been added for spectrogram and Colour 3D Plot, which improves readability for some data.
- Further performance improvements have been made to Colour 3D Plot.
- Various other bug fixes.
Sonic Visualiser is available as freeware (GNU General Public License) for Windows, Mac and Linux.
More information: Sonic Visualiser


