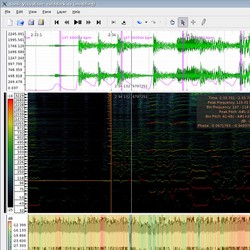
Chris Cannam of the Centre for Digital Music at Queen Mary, University of London, has released version 1.7 of Sonic Visualiser, an application for inspecting and analysing the contents of music audio files, combining powerful waveform and spectral visualisation tools with automated feature extraction plugins and annotation capabilities.
The aim of Sonic Visualiser is to be the first program you reach for when want to study a musical recording rather than simply listen to it.
We hope Sonic Visualiser will be of particular interest to musicologists, archivists, signal-processing researchers and anyone else looking for a friendly way to take a look at what lies inside the audio file.
Changes in Sonic Visualiser v1.7
- A new “Insert Item At Selection” function on the Edit menu can be used to create Note and Region layer items whose time extents correspond to the current selection(s).
- Interactively editing points in the Note and Region layers now works much more smoothly.
- SV can now import MIDI files that use SMPTE timecode for event timing (importing MIDI files using with the more common timebase-based timing was already supported).
- Time values throughout the display may optionally be shown in seconds and frames at various frame rates.
- A crash on exit in Windows has been fixed.
- A very unobtrusive user survey is now included.
- Various other bug fixes.
Sonic Visualiser is available as freeware (GNU General Public License) for Windows, Mac and Linux.
More information: Sonic Visualiser
 Save big with Plugin Boutique's Mixing Month Sale!

